Sales Analytics Dashboard
Here’s a comprehensive content framework for a business sales analytics dashboard:
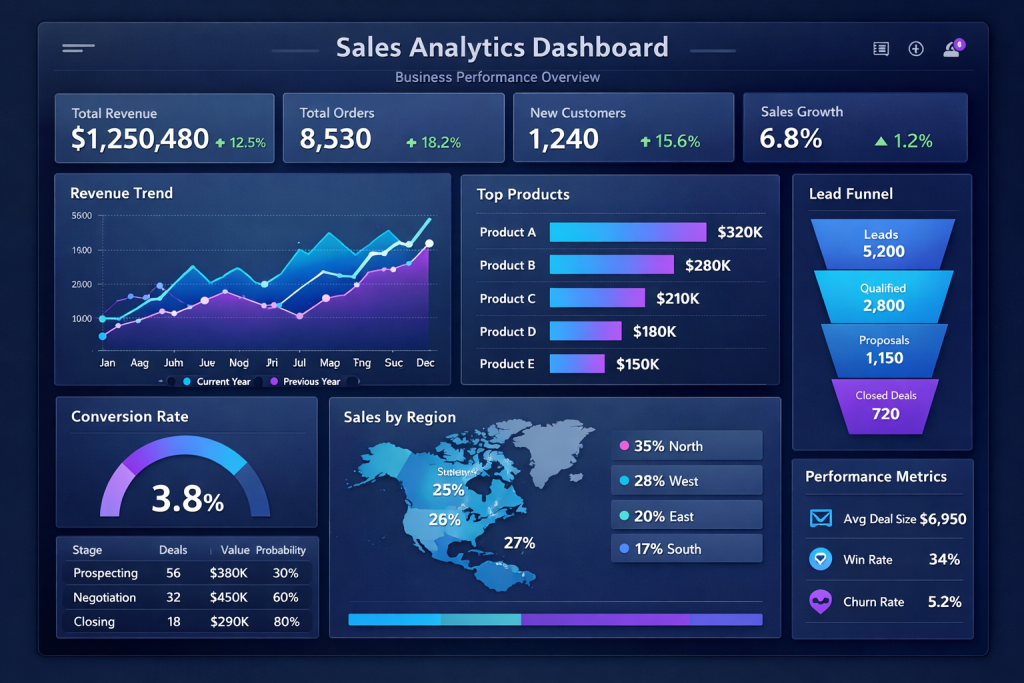
1. EXECUTIVE SUMMARY
KPI Scorecards
Total Revenue (Current Period vs Previous Period)
Revenue Growth (% MoM/YoY)
Sales Target Achievement (% of target)
Average Deal Size
Sales Cycle Length
Win Rate (%)
Customer Acquisition Cost (CAC)
Customer Lifetime Value (CLTV)
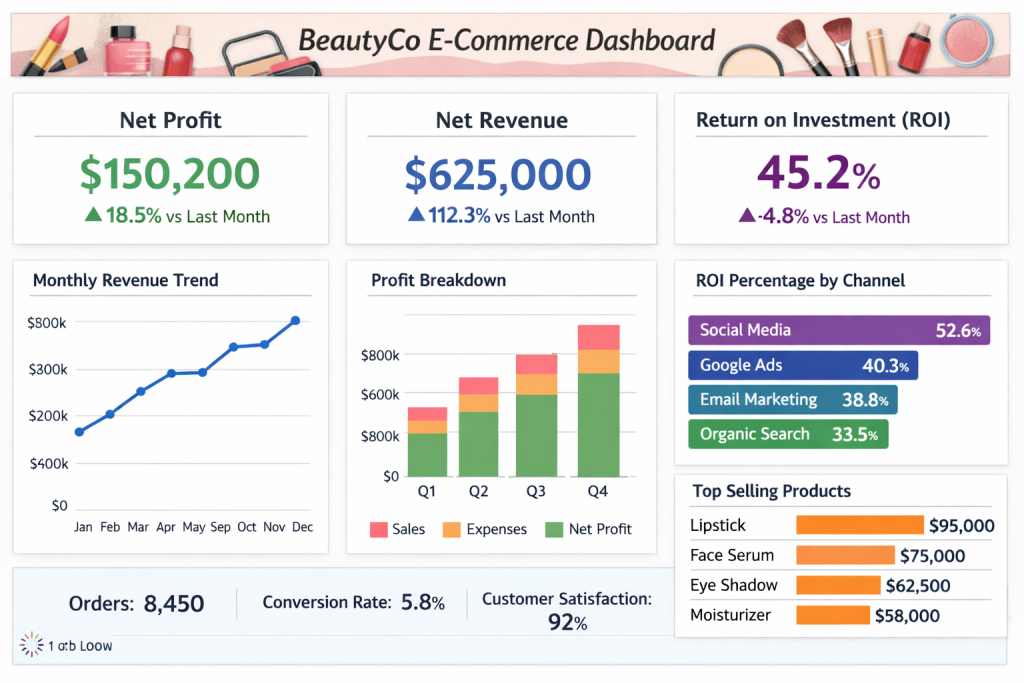
2. REVENUE ANALYTICS
Revenue Trends
Line chart: Revenue over time (daily/weekly/monthly)
Comparison: Current vs Previous Period
Revenue by product/service category
Revenue by sales channel
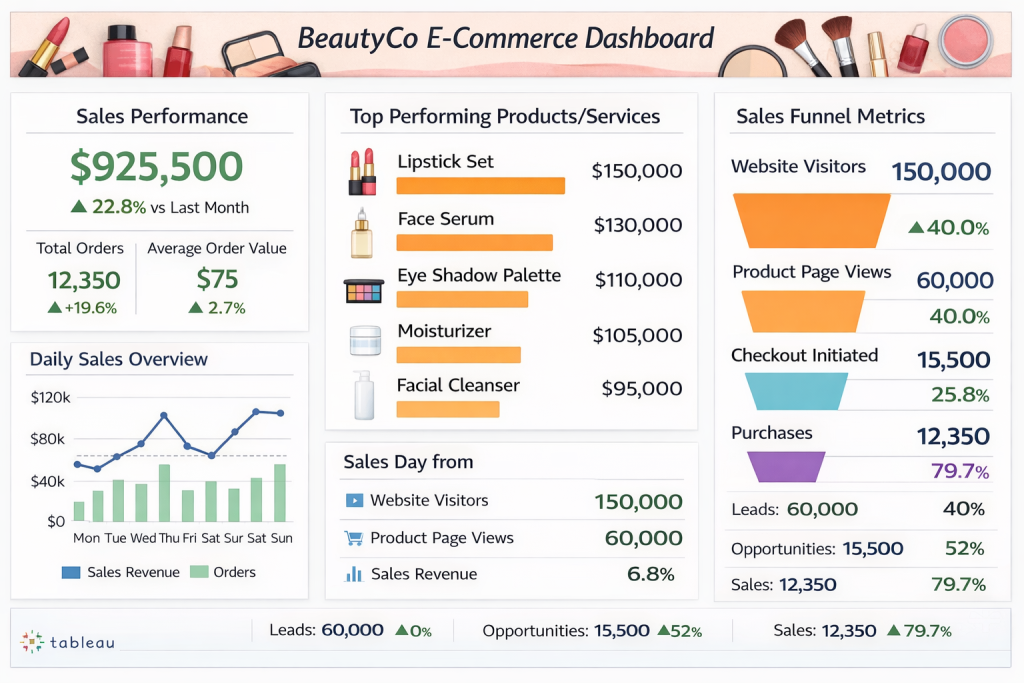
Sales Performance
Top Performing Products/Services
Revenue contribution by product
Quantity sold
Profit margins per product
Sales Funnel Metrics
Leads → Opportunities → Quotes → Closed Won
Conversion rates at each stage
Bottleneck identification
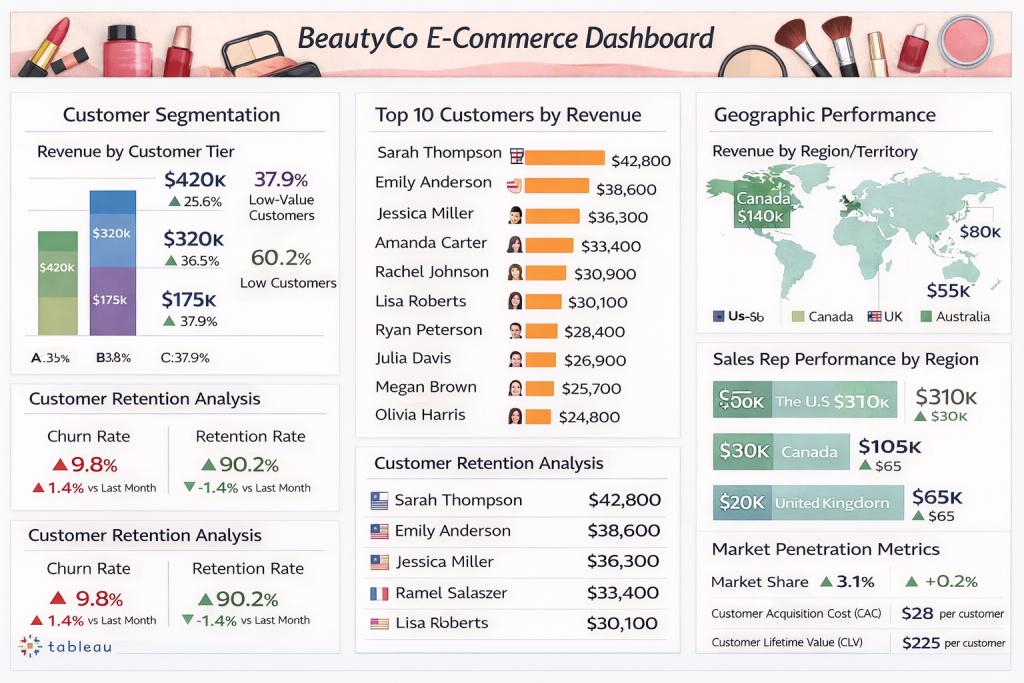
3. CUSTOMER & MARKET ANALYSIS
Customer Segmentation
Revenue by customer tier (A, B, C segments)
New vs Existing customers revenue split
Top 10 customers by revenue
Customer retention/churn rates
Geographic Performance
Revenue by region/territory
Sales rep performance by region
Market penetration metrics
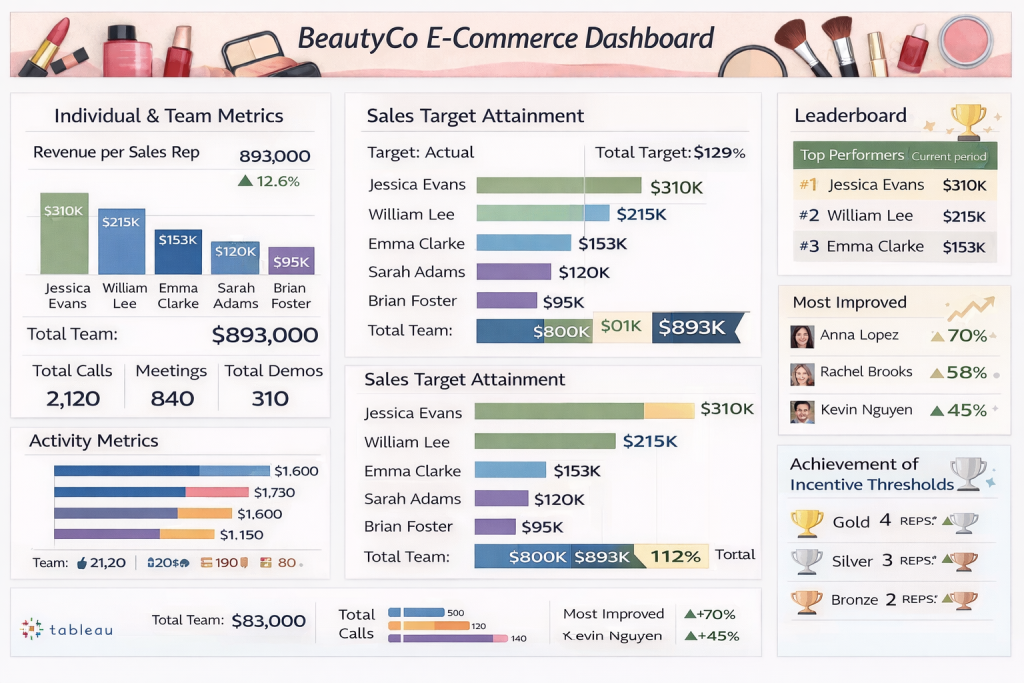
4. SALES TEAM PERFORMANCE
Individual & Team Metrics
Revenue per sales rep
Number of deals closed per rep
Average deal size per rep
Activity metrics (calls, meetings, demos)
Sales target attainment by rep/team
Leaderboard
Top performers (current period)
Most improved performers
Achievement of incentive thresholds
5. FORECASTING & PIPELINE
Sales Pipeline Health
Total pipeline value
Weighted pipeline (by probability)
Pipeline by stage
Aging analysis of opportunities
Forecasts
30/60/90 day revenue forecast
Forecast accuracy tracking
Quarter-to-date performance vs target
6. OPERATIONAL METRICS
Efficiency Metrics
Sales cycle length trends
Quote-to-close ratio
Lead response time
Cost of sales as % of revenue
Productivity Analysis
Revenue per sales hour
Tools/process adoption rates
Training impact on performance
7. COMPETITIVE & MARKET INSIGHTS
Market Position
Market share trends
Competitive win/loss analysis
Pricing competitiveness
Recommended Dashboard Layout:
Top Section (Priority View):
KPI scorecards (1 row)
Revenue trend chart
Middle Section (Tactical View):
Left: Team performance & leaderboard
Center: Sales funnel & pipeline
Right: Product/category performance
Bottom Section (Detailed Analysis):
Customer segmentation
Geographic heat map
Operational efficiency metrics
Implementation Notes:
Time Period Selector: Include filters for date ranges, comparison periods
Drill-down Capability: Allow clicking through from high-level metrics to detailed reports
Alert System: Visual indicators for metrics outside acceptable ranges
Export Functionality: PDF/Excel export for all views
Mobile Responsive: Critical metrics available on mobile view
Visualization Recommendations:
KPI Cards: Simple numbers with up/down indicators
Trends: Line/area charts
Comparisons: Bar/column charts
Composition: Pie/donut charts (sparingly)
Relationships: Scatter plots
Funnels: Actual funnel visualization
Geographic: Heat maps or filled maps
Data Refresh Cadence:
Real-time: Revenue, pipeline changes
Daily: Team performance metrics
Weekly: Forecasting updates
Monthly: Comprehensive performance review
This dashboard structure provides both strategic oversight for leadership and actionable insights for sales managers and reps, balancing high-level KPIs with operational details needed to drive performance.